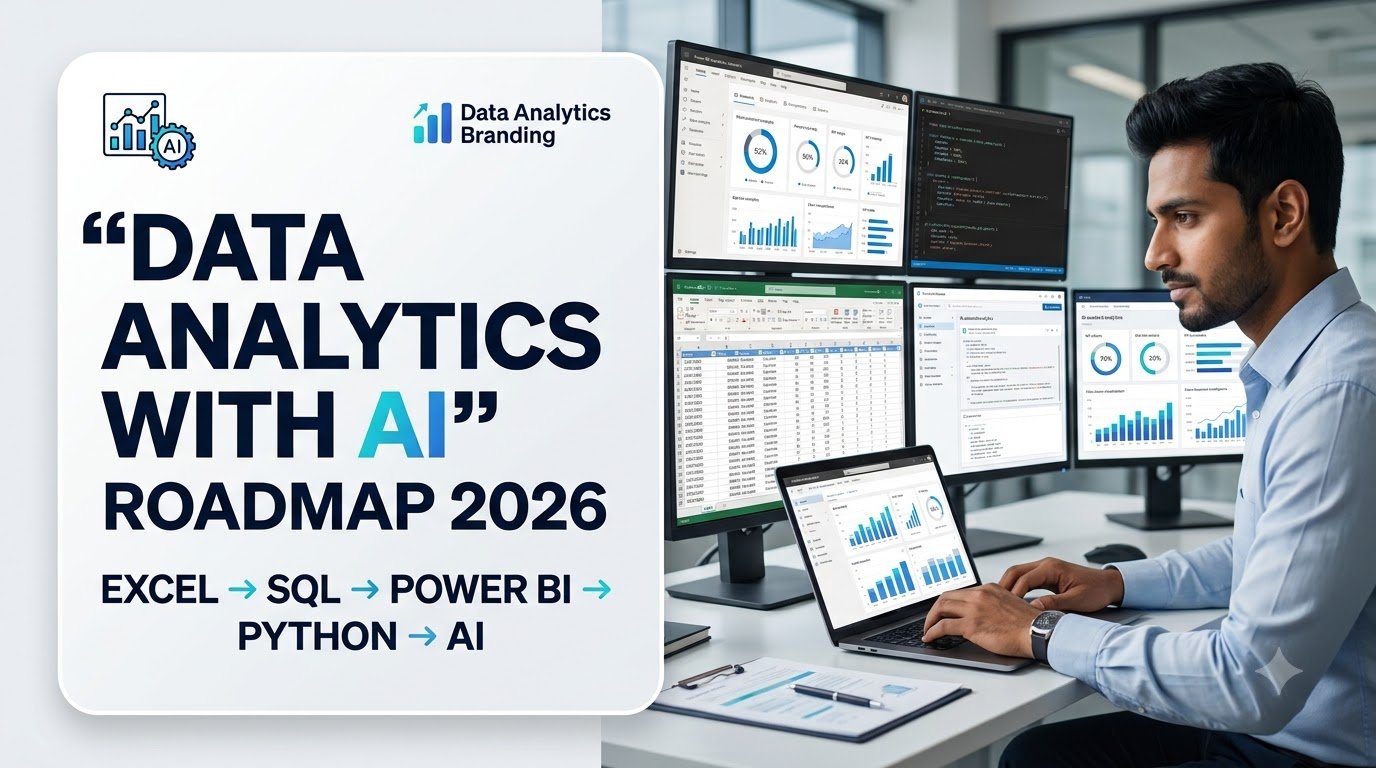
Data analytics is changing quickly. Earlier, becoming a data analyst mainly meant learning Excel, SQL, statistics and visualization tools. Today, AI tools are becoming part of everyday analytics work—from cleaning data and writing SQL queries to finding patterns, creating reports and explaining business insights.
But AI does not replace the fundamentals. If you want to build a career in Data Analytics with AI, the better approach is to first understand how data works and then learn how AI can make your analysis faster and more effective.
This Data Analytics with AI roadmap takes you from the basics to an advanced, job-ready skill set.
What Is Data Analytics with AI?
Data Analytics with AI means using traditional analytics skills together with Artificial Intelligence and Generative AI tools to collect, prepare, analyze and communicate data more efficiently.
A modern analyst may use:
- Excel for quick analysis
- SQL for working with databases
- Python for data analysis and automation
- Power BI or Tableau for dashboards
- Statistics for interpreting results
- AI tools for research, coding assistance and analysis
- Machine learning for more advanced predictive use cases
The goal is not simply to use AI. The goal is to use AI while still understanding the data and business problem yourself.
Data Analytics with AI Roadmap
A practical learning path looks like this:
Excel → SQL → Statistics → Power BI → Python → AI Tools → Advanced Analytics → Portfolio → Interview Preparation → Job
You don’t need to master everything at once. Build one layer at a time.
Step 1: Understand Data Analytics Fundamentals
Start by understanding what a data analyst actually does.
Learn the basic analytics process:
Business Problem → Data Collection → Data Cleaning → Analysis → Visualization → Insights → Decision
Understand terms such as:
- Dataset
- Rows and columns
- Variables
- KPIs
- Metrics
- Dimensions
- Data types
- Structured data
- Unstructured data
- Correlation
- Trends
- Outliers
At this stage, focus more on understanding concepts than learning complicated tools.
Time to Learn
Approximately 1–2 weeks with regular practice.
Step 2: Learn Microsoft Excel
Excel remains one of the most useful tools for analysts, especially for reporting and quick business analysis.
Start with:
- Basic formulas
- IF statements
- SUMIF/SUMIFS
- COUNTIF/COUNTIFS
- XLOOKUP
- INDEX and MATCH
- Sorting and filtering
- Conditional formatting
- Pivot Tables
- Charts
- Data validation
- Basic data cleaning
Then move toward:
- Power Query
- Advanced Pivot Tables
- Dashboard creation
AI + Excel
Once you understand Excel, AI tools can help you:
- Understand complicated formulas
- Create formulas from plain-English instructions
- Debug formulas
- Suggest analysis approaches
- Explain spreadsheet errors
- Generate ideas for dashboards
Don’t blindly copy AI-generated formulas. Always test and understand the result.
Step 3: Learn SQL
If Excel teaches you how to work with spreadsheets, SQL teaches you how to work with databases.
SQL is one of the most important skills for a data analyst.
Start with:
SELECTFROMWHEREORDER BYGROUP BYHAVING
Then learn:
JOINCASE WHENSubqueriesCTEsWindow FunctionsAggregate FunctionsDate Functions
You should eventually be comfortable answering questions such as:
- Which products generated the most revenue?
- Which customers purchased most frequently?
- What changed month over month?
- Which region performed best?
- Which customers have not purchased recently?
AI + SQL
AI can help you:
- Convert questions into SQL
- Explain SQL queries
- Find query errors
- Optimize queries
- Generate practice datasets
- Create SQL exercises
But don’t become dependent on AI. You should be able to write and understand SQL yourself.
Step 4: Learn Statistics
You don’t need to become a mathematician to become a data analyst.
Focus on statistics that are actually useful for analyzing business data.
Learn:
- Mean
- Median
- Mode
- Range
- Variance
- Standard deviation
- Percentiles
- Probability basics
- Correlation
- Sampling
- Distribution
- Hypothesis testing
- Confidence intervals
Later, learn concepts such as:
- Regression
- A/B testing
- Statistical significance
Statistics helps you understand whether a pattern in your data is meaningful or simply random variation.
Step 5: Learn Power BI
After Excel and SQL, move into data visualization and business intelligence.
Power BI is particularly useful for creating interactive business dashboards.
Learn:
- Power BI Desktop
- Data import
- Power Query
- Data cleaning
- Relationships
- Data modelling
- Measures
- DAX
- Filters
- Slicers
- Drill-through
- Interactive dashboards
Build dashboards around real business questions instead of simply putting charts on a page.
For example:
Sales Dashboard
Track:
- Revenue
- Profit
- Orders
- Top products
- Regional performance
- Monthly trends
Step 6: Learn Python for Data Analytics
Python becomes especially useful when your analysis involves larger datasets, automation or more advanced analytics.
Start with:
Python Fundamentals
Learn:
- Variables
- Data types
- Conditions
- Loops
- Functions
- Lists
- Dictionaries
- File handling
Then learn important analytics libraries:
- Pandas
- NumPy
- Matplotlib
Later you can explore:
- Seaborn
- Scikit-learn
With Python, practice:
- Reading CSV files
- Cleaning datasets
- Handling missing values
- Removing duplicates
- Grouping data
- Merging datasets
- Creating charts
- Automating repetitive tasks
Step 7: Add AI to Your Data Analytics Workflow
This is where the “with AI” part of the roadmap becomes important.
You can use tools such as ChatGPT, Gemini, Claude or Microsoft Copilot to assist with analytics tasks.
AI can help with:
Data Cleaning
Ask AI to suggest approaches for:
- Missing values
- Duplicate records
- Inconsistent formats
- Outliers
- Data validation
SQL
AI can help generate and explain queries.
Python
You can use AI as a coding assistant to:
- Explain code
- Debug errors
- Create functions
- Improve scripts
- Suggest approaches
Data Interpretation
AI can help you identify potential patterns and generate questions worth investigating.
Reporting
AI can help turn analytical findings into:
- Executive summaries
- Business recommendations
- Presentation points
- Report drafts
The analyst should still verify the numbers and conclusions before sharing them.
Step 8: Learn Prompt Engineering for Analytics
You don’t need complicated AI prompts.
The important thing is learning how to give AI enough context.
A useful analytics prompt can include:
Role + Data Context + Task + Constraints + Expected Output
For example:
Act as a business analyst. Analyze the provided monthly sales data, identify the three biggest changes, explain possible reasons and present the findings in a concise management summary.
You can also ask AI to:
- Explain a dataset
- Generate SQL practice questions
- Review your analysis
- Suggest KPIs
- Create dashboard ideas
- Generate interview questions
- Explain statistical concepts
Step 9: Learn AI-Assisted Data Visualization
AI can also help with dashboard planning.
For example, you can give AI your business objective and ask it to suggest:
- KPIs
- Chart types
- Dashboard layout
- Filters
- Segments
- Business questions
But don’t create dashboards simply because they look attractive.
A good dashboard should answer a business question quickly.
Example
Instead of:
“Here are 15 charts.”
Build:
“Why did monthly sales decline?”
Then use relevant KPIs and visuals to answer that question.
Step 10: Learn Basic Machine Learning
You don’t need advanced machine learning to get your first data analyst job.
However, understanding basic ML concepts can help you move toward more advanced analytics.
Start with:
- Supervised learning
- Unsupervised learning
- Regression
- Classification
- Clustering
- Train/test split
- Features
- Target variables
- Model evaluation
Learn these concepts practically rather than spending months on mathematical theory.
Step 11: Build Real Data Analytics Projects
This is one of the most important steps.
Don’t finish five courses and then start looking for a job without a portfolio.
Build 3–5 strong projects.
Project 1: Sales Dashboard
Tools:
Excel + Power BI
Analyze:
- Revenue
- Profit
- Products
- Regions
- Monthly performance
Project 2: Customer Analysis
Tools:
SQL + Power BI
Analyze:
- Customer segments
- Purchase frequency
- Revenue
- Retention
- Customer behavior
Project 3: E-Commerce Analysis
Tools:
Python + Pandas + Power BI
Analyze:
- Orders
- Customers
- Products
- Revenue
- Returns
Project 4: AI-Powered Analytics
Tools:
Python + SQL + AI
Use AI to assist with:
- Data exploration
- SQL generation
- Data cleaning
- Insight generation
- Report creation
Project 5: Business Intelligence Project
Build an end-to-end project:
Raw Data → SQL → Python → Power BI → Business Recommendations
This type of project can demonstrate several skills together.
Step 12: Build Your Portfolio
A resume saying:
“I know Excel, SQL, Python and Power BI.”
is useful.
But a portfolio showing:
“I analyzed 50,000 sales records and built an interactive Power BI dashboard that identified the highest-performing regions and products.”
is much stronger.
Your portfolio can include:
- Project description
- Business problem
- Dataset
- Tools used
- Cleaning process
- Analysis
- Dashboard screenshots
- Key findings
- Business recommendations
- GitHub repository, where applicable
Step 13: Prepare Your Resume
Keep your resume focused on results and projects, not just a list of courses.
Instead of:
Learned Power BI.
Write:
Built an interactive Power BI sales dashboard analyzing revenue, profit and regional performance.
Instead of:
Learned Python.
Write:
Used Python and Pandas to clean and analyze customer transaction data.
This gives recruiters something concrete to evaluate.
Step 14: Prepare for Data Analyst Interviews
Once your technical foundation is ready, start interview preparation.
Prepare for questions related to:
Excel
- XLOOKUP
- Pivot Tables
- IF/SUMIFS
- Data cleaning
SQL
- JOINs
- GROUP BY
- CASE
- CTEs
- Window functions
Power BI
- Data modelling
- DAX
- Relationships
- Dashboard design
Python
- Pandas
- Data cleaning
- Basic data manipulation
Statistics
- Mean vs median
- Correlation
- Standard deviation
- A/B testing
Business Questions
You may also be asked:
“Sales dropped 15% this month. How would you investigate it?”
The interviewer is testing your thinking process, not just your technical knowledge.
Data Analytics with AI Roadmap: 6-Month Plan
If you are starting from zero, you can structure your learning like this:
| Month | Focus |
|---|---|
| Month 1 | Analytics Fundamentals + Excel |
| Month 2 | SQL + Database Concepts |
| Month 3 | Statistics + Power BI |
| Month 4 | Python + Pandas |
| Month 5 | AI Tools + AI-Assisted Analytics |
| Month 6 | Projects + Portfolio + Interview Preparation |
The timeline is flexible. Someone studying several hours every day may progress faster, while someone learning alongside college or work may need more time.
Data Analytics with AI Skill Stack
A practical job-ready stack can look like:
Core
Excel
SQL
Statistics
↓
Business Intelligence
Power BI
Power Query
DAX
↓
Programming
Python
Pandas
NumPy
↓
AI
Generative AI
Prompting
AI-assisted SQL
AI-assisted Python
AI-assisted reporting
↓
Advanced
Machine Learning
Automation
Predictive Analytics
↓
Career
Projects
Portfolio
Resume
Interview Preparation
Can AI Replace Data Analysts?
AI can automate some repetitive analytics tasks, but that does not mean the entire data analyst role disappears.
An analyst still needs to understand:
- What question the business is asking
- Whether the data is reliable
- Which metrics actually matter
- Whether an AI-generated result makes sense
- How to communicate findings
- What action the business should take
The strongest professionals will likely be those who combine analytics fundamentals with AI skills rather than relying entirely on AI.
Is Data Analytics with AI a Good Career Choice?
It can be a strong career direction for people who enjoy working with numbers, technology and business problems.
The combination is especially useful because modern analytics increasingly involves multiple tools and workflows.
A practical career progression could look like:
Data Analyst → Senior Data Analyst → Business Intelligence Analyst → Analytics Manager
or, depending on your interests:
Data Analyst → Analytics Engineer → Data/AI-focused roles
Your exact path will depend on your technical skills, domain knowledge and experience.
Final Roadmap
If you want the shortest version of the entire roadmap, follow this order:
1. Excel
↓
2. SQL
↓
3. Statistics
↓
4. Power BI + DAX
↓
5. Python + Pandas
↓
6. Generative AI Tools
↓
7. AI-Assisted Analytics
↓
8. Basic Machine Learning
↓
9. Build 3–5 Projects
↓
10. Portfolio + Resume
↓
11. Interview Preparation
↓
12. Apply for Data Analyst Jobs
The biggest mistake is trying to learn Excel, SQL, Python, Power BI, AI and Machine Learning simultaneously.
Instead, learn one skill, practice it with a real dataset, build something with it and then move to the next layer.
Fundamentals first. AI second. Projects throughout.
That combination can give you a much stronger foundation for a modern Data Analytics with AI career.